

LLM Observability and Tracing: Spans, Latency, Cost, Feedback
LLM observability explained: traces and spans, what to log, PII masking, p95 latency, cost by prompt version, and OpenTelemetry GenAI and Langfuse tracing code.
When a Chappan Express parcel arrives late, the operations team does not guess. Every parcel is scanned at the kitchen, at pickup, at each hand-off and at the door, with a timestamp. One look at the scans shows it sat 18 minutes at a hub near Vijay Nagar.
Now a customer complains that Chappan Help took nine seconds to answer and then quoted the wrong refund window. Without scans, the team would argue about whether the model, the retriever or the network was at fault.
LLM observability puts scanners inside the chatbot.
What is LLM observability?
LLM observability is the practice of collecting structured traces, metrics and feedback from every request to an LLM application, including inputs, intermediate steps, outputs, token usage, cost and latency, so that its behaviour in production can be understood, debugged and improved.
It extends classic monitoring. ML model monitoring watches input drift and accuracy for a model with a numeric output. An LLM app is a pipeline of steps whose output is free text, so you also need to see what each step did, not just how long it took.
Evaluation vs observability
LLM evaluation runs a fixed test set before release. Observability watches real traffic after release. They feed each other: production traces reveal new failure types, and those become new test cases.
| Question | Evaluation | Observability |
|---|---|---|
| When does it run? | Before release, on every change | Continuously, on live traffic |
| What inputs? | Curated golden set | Whatever real users send |
| Main output | Scores per version | Traces, dashboards, alerts |
| Finds | Regressions you anticipated | Failures you did not anticipate |
Traces and spans: the building blocks
A trace is the full record of one request. A span is one timed step inside it, with a name, start time, end time, parent span and attributes such as token counts. Spans nest, so a retrieval span can contain an embedding span and a vector search span.
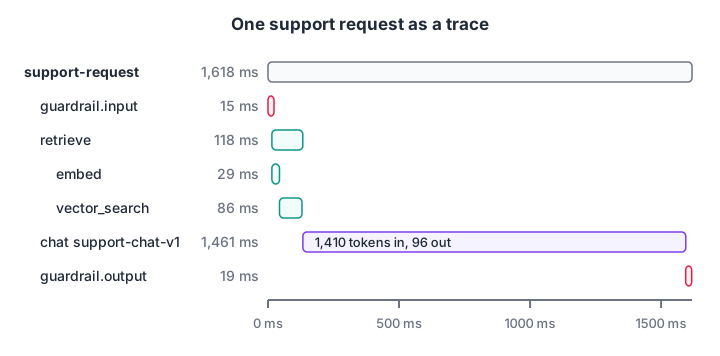
The waterfall shows at a glance which step made this request slow.
The block below builds a trace for one Chappan Help request with a simulated clock and prints it as a waterfall. Real tracing libraries do exactly this, with real time.
import itertools, uuid

clock = itertools.count(0, 1)          # simulated milliseconds
spans, stack = [], []

class span:
    def __init__(self, name, ms, **attrs):
        self.name, self.ms, self.attrs = name, ms, attrs
    def __enter__(self):
        self.parent = stack[-1].name if stack else None
        self.depth, self.start = len(stack), next(clock)
        stack.append(self); return self
    def __exit__(self, *exc):
        for _ in range(self.ms): next(clock)
        stack.pop(); self.end = next(clock); spans.append(self)

trace_id = uuid.uuid4().hex[:8]
with span("support-request", 0, user="cust_***41", prompt_version="v8"):
    with span("guardrail.input", 14): pass
    with span("retrieve", 0, k=2):
        with span("embed", 28): pass
        with span("vector_search", 85): pass
    with span("chat support-chat-v1", 1460, input_tokens=1410, output_tokens=96): pass
    with span("guardrail.output", 18): pass

total = max(s.end for s in spans)
print(f"trace {trace_id}, total {total} ms")
for s in sorted(spans, key=lambda s: s.start):
    bar = " " * int(30 * s.start / total) + "#" * max(1, int(30 * (s.end - s.start) / total))
    print(f"{'  ' * s.depth + s.name:<26} {s.end - s.start:>5} ms |{bar:<31}| {s.attrs or ''}")
The model call takes over 90% of the request, so shortening retrieval would barely help this user. That is the kind of answer a trace gives in seconds.
Quick check
In a trace for one Chappan Help request, what is a span?
A trace is one request; spans are its nested, timed steps.
What should you log for each LLM request?
Log enough to replay and explain a request, but no more personal data than you need.
- Identifiers: trace ID, session ID, anonymised user ID, app release, prompt version and model alias.
- Inputs and outputs: the user message, the final prompt sent (or its template plus variables) and the reply.
- Intermediate steps: retrieved document IDs and scores, tool calls with arguments and results, guardrail decisions.
- Usage: input tokens, output tokens, cached tokens and computed cost.
- Timing: span durations, time to first token and total latency.
- Feedback: thumbs up or down, escalation to a human, and later judge scores on a sample.
Mask personal data first
Support chats contain phone numbers, addresses and order IDs. Mask them before the trace leaves your service, not later in the dashboard.
import re

PATTERNS = [
    (re.compile(r"\b[6-9]\d{4}[- ]?\d{5}\b"), "<PHONE>"),
    (re.compile(r"\b[\w.+-]+@[\w-]+\.[\w.]+\b"), "<EMAIL>"),
    (re.compile(r"\border\s*#?\s*\d{5,}\b", re.I), "order <ORDER_ID>"),
]

def mask(text):
    for pattern, token in PATTERNS:
        text = pattern.sub(token, text)
    return text

msg = "Order #882311 never came, call me on 98260 11223 or mail ritu.s@example.com"
print(mask(msg))
Pattern masking misses things, so also limit who can read raw traces and set a retention period.
Latency percentiles: why averages lie
Latency in LLM apps has a long tail. Most replies are quick, but long prompts, queueing at peak and retries create a few very slow ones. The average hides them, so dashboards show percentiles: p50 (median), p95 and p99.
import numpy as np

rng = np.random.default_rng(8)
n = 5000
retrieval = rng.lognormal(np.log(0.12), 0.35, n)
queue = np.where(rng.random(n) < 0.10, rng.exponential(2.5, n), 0.0)   # dinner-peak queueing
llm = rng.lognormal(np.log(1.4), 0.30, n)
total = retrieval + queue + llm

print(f"mean {total.mean():.2f} s | p50 {np.percentile(total, 50):.2f} s | "
      f"p95 {np.percentile(total, 95):.2f} s | p99 {np.percentile(total, 99):.2f} s")
slow = total > np.percentile(total, 95)
for name, part in [("retrieval", retrieval), ("queue", queue), ("llm", llm)]:
    print(f"{name:<9} share of time in slowest 5%: {part[slow].sum() / total[slow].sum():.0%}")
print("SLO p95 < 3.0 s:", "met" if np.percentile(total, 95) < 3.0 else "BREACHED")
The median looks healthy, but the p95 breaches the target. Breaking the slowest 5% down by span shows queueing as about 70% of the time in the slow requests, which points to more serving capacity at peak, not a faster retriever. The queue figure comes straight from metrics like those in serving with vLLM.
Quick check
Median latency is 1.6 s but p95 is 4.2 s against a 3 s target. What should you do first?
Percentile breakdowns by span show whether queueing, retrieval or the model causes the slow tail.
Dashboards: cost and quality by version
Aggregate traces by prompt version, model alias or day. A small table often reveals what a single average cannot.
import pandas as pd

logs = pd.DataFrame({
    "prompt_version": ["v7"] * 5 + ["v8"] * 5,
    "input_tokens":  [2400, 2300, 2500, 2350, 2450, 1400, 1450, 1380, 1420, 1410],
    "output_tokens": [210, 190, 230, 205, 220, 150, 140, 160, 145, 155],
    "thumbs_down":   [0, 0, 1, 0, 0, 0, 1, 1, 0, 1],
    "escalated":     [0, 0, 0, 0, 1, 0, 1, 0, 0, 1],
})
logs["cost_rs"] = logs.input_tokens * 12e-6 + logs.output_tokens * 48e-6   # placeholder prices
report = logs.groupby("prompt_version").agg(
    chats=("cost_rs", "size"), cost_per_chat=("cost_rs", "mean"),
    thumbs_down_rate=("thumbs_down", "mean"), escalation_rate=("escalated", "mean"))
print(report.round(3).to_string())
Version 8 is cheaper per chat, but more users dislike its answers and more chats escalate. That is a signal to sample v8's thumbs-down traces, read them, and add the failures to the golden set. In real life you would wait for hundreds of chats per version before trusting rates like these.
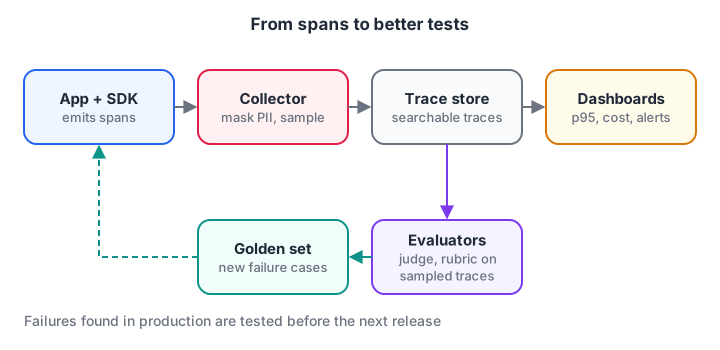
Observability closes the LLMOps loop: production failures become tomorrow's evaluation cases.
Instrumenting with OpenTelemetry and Langfuse
You rarely hand-roll tracing. OpenTelemetry is the open standard for traces and metrics, and its GenAI semantic conventions (still marked as in development) define attribute names such as gen_ai.operation.name, gen_ai.request.model and gen_ai.usage.input_tokens. The convention for a model-call span name is the operation followed by the model, such as chat support-chat-v1.
from opentelemetry import trace
from opentelemetry.sdk.trace import TracerProvider
from opentelemetry.sdk.trace.export import BatchSpanProcessor, ConsoleSpanExporter

provider = TracerProvider()
provider.add_span_processor(BatchSpanProcessor(ConsoleSpanExporter()))  # swap for an OTLP exporter
trace.set_tracer_provider(provider)
tracer = trace.get_tracer("chappan-help")

with tracer.start_as_current_span("support-request") as root:
    root.set_attribute("app.prompt_version", "v8")
    with tracer.start_as_current_span("chat support-chat-v1", kind=trace.SpanKind.CLIENT) as s:
        s.set_attribute("gen_ai.operation.name", "chat")
        s.set_attribute("gen_ai.provider.name", "vllm")          # check the registry for your provider value
        s.set_attribute("gen_ai.request.model", "support-chat-v1")
        reply, usage = call_model(question)                         # your client code
        s.set_attribute("gen_ai.usage.input_tokens", usage.prompt_tokens)
        s.set_attribute("gen_ai.usage.output_tokens", usage.completion_tokens)
Langfuse is an open-source LLM observability platform built on OpenTelemetry. Its Python SDK wraps functions with a decorator and records generations with model and usage details.
from langfuse import get_client, observe, propagate_attributes

langfuse = get_client()   # reads LANGFUSE_PUBLIC_KEY, LANGFUSE_SECRET_KEY and LANGFUSE_HOST

@observe(name="retrieve")
def retrieve(question):
    return search_help_centre(question, k=2)

@observe(name="support-request")
def answer(question, session_id):
    with propagate_attributes(session_id=session_id, version="prompt-v8"):
        docs = retrieve(question)
        with langfuse.start_as_current_observation(
                as_type="generation", name="chat", model="support-chat-v1") as gen:
            reply, usage = call_model(question, docs)
            gen.update(input=question, output=reply,
                       usage_details={"input_tokens": usage.prompt_tokens,
                                      "output_tokens": usage.completion_tokens})
        return reply

answer("Raita missing, refund?", session_id="s-1029")
langfuse.flush()
Both snippets follow the current documentation of each project; SDK versions move fast, so check them before copying. For agents with many tool calls, the same spans apply, as shown in deploying AI agents.
Alerts worth setting
- p95 latency or TTFT above target for 10 minutes.
- Error rate or empty-reply rate above 1%.
- Cost per chat 20% above last week's median.
- Thumbs-down or escalation rate up sharply after a release.
- Guardrail block rate spiking, which can mean an attack or a broken prompt.
Common LLM observability mistakes
- Logging only the final answer. Without retrieved context and tool results, you cannot tell why it was wrong.
- Watching averages. Alert on p95 and p99.
- Storing raw personal data. Mask at the source and limit retention.
- No prompt version in traces. Then you cannot connect a quality drop to a release.
- Dashboards nobody reads. Schedule a weekly review of the worst traces.
Key takeaways
- LLM observability records traces of every request: inputs, steps, outputs, tokens, cost, latency and feedback.
- Traces contain nested spans; the waterfall shows where time goes.
- Use percentiles for latency, and break cost and quality down by prompt version.
- Mask personal data before storage; OpenTelemetry GenAI conventions and Langfuse standardise the rest.
- Feed production failures back into the golden set. To show these skills off, see Generative AI projects for your portfolio.
FAQ
What is the difference between LLM monitoring and LLM observability?
Monitoring watches known metrics, such as latency, error rate and cost, and alerts when they cross a threshold. Observability goes further by recording detailed traces of each request, so you can investigate problems you did not predict, such as why a specific answer quoted the wrong policy. Monitoring tells you something is wrong; observability helps you find why.
What is a trace in LLM applications?
A trace is the complete record of one request through an LLM application. It is made of spans for each step, such as guardrails, retrieval, tool calls and the model call, each with timing, inputs, outputs and attributes like token counts. Traces let you replay and debug individual conversations.
What tools are used for LLM observability?
Popular open-source options include Langfuse, Arize Phoenix and OpenLLMetry, most of which build on OpenTelemetry. General observability stacks such as Prometheus and Grafana handle serving metrics, while vLLM exposes its own metrics endpoint. The OpenTelemetry GenAI conventions help keep data portable between tools.
Should I log full prompts and responses?
Log them if you need to debug quality, but mask personal data first, restrict access and set a retention period. Some teams store full text only for a sample, or only for requests with negative feedback. Always log prompt version, token counts and retrieved document IDs, which carry little privacy risk.
Where can I learn LLMOps and observability in Indore?
Debugshala, an Indore training and placement institute at Old Palasia, teaches Generative AI in offline classes in English and Hindi, covering how to build, deploy and monitor LLM apps. A mentor-led GenAI programme with tracing and monitoring labs begins with a free demo class. Revise pandas and statistics with Debugshala Test MCQs.
From the team behind this site
Go further with the Generative AI Course at Debugshala
These tutorials are written by Debugshala, a training and placement institute at Old Palasia, Indore. The classroom course adds live mentoring, real projects and interview preparation.
- Offline classes at Old Palasia, Indore
- Free demo class before you pay
- Non-IT, fresher and year-gap friendly
- Placement assistance
700+ students placed · 200+ hiring partners · 4.9★ Google rating
